


Working with Vector tiles - DAE
the workshop starts here
Maplibre is a open source JavaScript library that uses WebGL to render interactive maps from vector tiles and Mapbox conform styles.
This workshop will help you set up a simple webpage and create a Maplibre map based on vector tiles from Maptiler.
Introduction
Vector Tiles
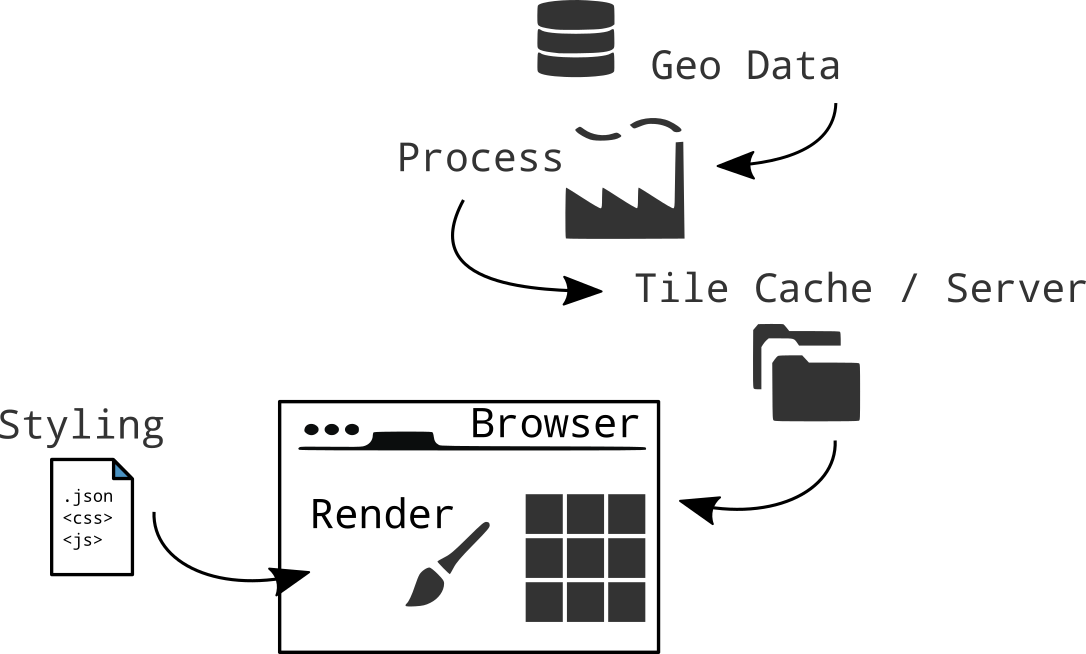
Vector tiles are a way to deliver geographic data in small chunks to a browser or other client app. Vector tiles are similar to raster tiles but instead of raster images the data returned is a vector representation of the features in the tile.
Vector tiles make huge maps fast while offering full design flexibility. They are the vector data equivalent of image tiles for web mapping, applying the strengths of tiling – developed for caching, scaling and serving map imagery rapidly – to vector data.
Vector tiles have two important advantages over fully rendered image tiles:
- Styling - as vectors, tiles can be styled when requested, allowing for many map styles on global data
- Size - vector tiles are really small, enabling global high resolution maps, fast map loads, and efficient caching
As the name suggests, vector tiles contain vector data instead of the rendered image. They contain geometries and attributes – like road names, place names, house numbers – in a compact, structured format. Vector tiles are rendered only when requested by a client, like a web browser or a mobile app. Rendering happens in the client.
Mapbox vector tile standard - pbf
Mapbox has defined an open standard for vector map tiles called vector-tile-spec which uses Google protocol buffers for space-efficient data serialization. Web Mercator is the projection of reference, but vector tiles may be used to represent data with any projection and tile extent scheme.
More about Mapbox vector tile: https://www.mapbox.com/vector-tiles/specification/
Maplibre GL JS
Maplibre is a open source JavaScript(typeScript) library that uses WebGL to render interactive maps from vector tiles in the browser. Maplibre GL JS does not contain the vector tiles or styles needed to render the map. It simply brings together the tools en technology needed to render the map, customize the map and make it interactive.
![]()
Vector Tile Providers
To make a vector tile map we need some vector tiles. It is possible, but a lot of work to make them yourself. Therefore there are also a lot of providers that offer services and styles for different maps.
Since the vector tile technology stared with Mapbox. This company also offers a lot of maps, data and possibilities to host your own data as vector tiles.
Maptiler is another company offering maps and styles. More focused on open source data and standards. They have free plans for starting developers and students. Therefore we will work with their services in this workshop.
Also PDOK or other governmental institutions might offer vector tiles for free of use.
A small overview of tile providers:
In the next step we will learn how to use the Maplibre GL.js library with Maptiler maps! And learn how to manipulate the style with JavaScript at the client side.
Making Vector Tiles
Making your own tiles is possible. You can find a list of all tile generators here.
Maptiler
In order to use the MapTiler maps we need a MapTiler account.
Go to Maptiler.com and create an account. See MY CLOUD
When you are logged in we have access to:
- Maps - Using existing maps (tiles plus styling)
- Tiles - Access to the vecotor tiles in order to create our own styling
- Data - Upload our own data
Go to Maps and choose a style you like.
When looking at the map details, there is a lot of information on how to use this map in another web page.
Go to Customize a copy. This takes us to the style editor!
Have a look around and adjust the map to your likings! Do not spend to much time on it now. You can always come back to this later.
When finished, save the map on your profile.
Leave the page open for now. We will use this style in our own web page later. Let’s set up our own web page first.
Basics: Setting up our map webpage
Here we will set up our own web page with a Maplibre GL.js map from scratch. For the maps we we will use already provided styles and tiles from Maptiler.
During the workshop we will work with a simple HTML page example. The best practice is to create a directory for you web page. Containing all files, images and data needed for the page.
Create a working directory for your webpage, on your computer. In this directory we will place all data and files for this workshop. During the workshops this will be referred to as 📂 working directory
For this workshop, we assume you already know HTML,CSS and some JavaScript.
🔗 If you are not that comfortable with HTML, CSS and JavaScript yet, this Making a Web page tutorial will help you along!
HTML starting
Open your text editor.
Create an empty file to make your basic HTML page. Copy the following into your file:
<!DOCTYPE html>
  <html>
    <head>
      <title> My title </title>
    </head>
  <body>
    <H1>Example</H1>
  </body>
</html>
Save the file in 📂yourDirectory and call the file index.html.
Change the title to something like : “My first Maplibre map".
Creating the map container
A <div> is a kind of frame where our map will come! This frame does not contain anything yet. We will have to give it some dimensions in order to show content. We will specify the width and height with CSS, so the <div> can be seen. Later, we will give content to the <div> with JavaScript. To be able to do that, we will need its id to be able to reference it.
Place a <div> in the <body>
Like this:
<div id="map"></div>
CSS - Creating the css
Open a new file and save this as main.css in 📂yourDirectory.
With CSS we will style our <div> object. In the main.css we will reference to the <div> with a #map selector which indicates a object with the id="map" in the HTML. Now set the rule height(and optional width).
Copy this into your CSS file:
#map {
  height: 500px;
  width:100%;
}
Change the amount of pixels and/or percentage to the map size you prefer.
To link our CSS file with our HTML objects we will have to put a link in our HTML file.
Go back to your index.html file and put the link to your CSS file in the <head>.
<link rel="stylesheet" href="main.css"/>
JS - Setting up Maplibre.js
Now we will add the JavaScrip Library Maplibre.js.
Go to the maplibre page to use the latest hosted version of Maplibre. We also need the CSS.
Scorll down to CDN and copy the latest version:
<script src='https://unpkg.com/maplibre-gl/dist/maplibre-gl.js'></script>
<link href='https://unpkg.com/maplibre-gl/dist/maplibre-gl.css' rel='stylesheet' />
Include the JavaScript and CSS files in the <head> of your HTML file.
The last thing we need is add is a JavaScript file for our own custom JavaScript.
Make a new file and save the file in 📂yourDirectory
and call the file main.js.
Now include the <script> in the <body> of your HTML file.
Your HTML file should look like this:
<!doctype html>
<html>
  <head>
    <title>My first Maplibre GL map</title>
   <script src='https://unpkg.com/maplibre-gl/dist/maplibre-gl.js'></script>
<link href='https://unpkg.com/maplibre-gl/dist/maplibre-gl.css' rel='stylesheet' />
    <link rel="stylesheet" href="main.css"/>
  </head>
  <body>
    <H1>example</H1>
    <div id="map"></div>
    <script src="main.js"></script>
  </body>
</html>
Now open the HTML file in your browser.
You will only see a title. This is correct! If you wonder why you do not see a map… Well we haven’t added a map or the code for that yet!
Creating a map with Maplibre.js
In the JavaScript file we need to define our map.
var map = new maplibregl.Map({
        container: 'map', // container id
        style: 'https://demotiles.maplibre.org/style.json', // style URL
        center: [0, 0], // starting position [lng, lat]
        zoom: 1, // starting zoom
        hash: true
    });
Copy this code into your main.js file and save it.
ℹ️ new maplibregl.Map({...}); creates a Maplibre GL Map object!
ℹ️ container: "map" places the map in our <div id="map"> object from the HTML file.
ℹ️ style: 'https://demotiles.maplibre.org/style.json' is the url for demo map with the tiles, style, fonts and Glyphs!. You can also open up this url in the browser to see the complete information.
This file is conform the Mapbox style specifications and contains all the elements we need for a map:
- Vector Tiles
- Styling information
- Fonts, Sprites and Glyphs
![]()
ℹ️ hash: true puts the #location in the URL of our map. With /zoom/lat/long/angle. See what happens to the URL of your map when you pan around.
ℹ️ zoom,pitch , bearing and center set the starting position of our map when opening it the first time. Now pointing to Amsterdam.
Refresh the file in your browser and you will see the Maplibre demo map!
Changing Map options
Maplibre.js offers us a whole range of map options. Have a look at the documentation
Change the center coordinates, zoom level and the bounds. For example, focus the map on area of interest.
ℹ️ Looking for a specific place to centre on? Find your coordinates here: mapcoordinates.net
ℹ️ The minZoom and maxZoom restrict the map from zooming in or out further then those zoom levels. If you want to know how far “zoomed” in you are, have a look at this description of scales and examples about zoom levels.
ℹ️ The maxBounds are the coordinates of a bounding box to which the user is restricted. Check the latlngbounds documentation. 🔗 Finding easy creation of bounding boxes at: https://boundingbox.klokantech.com/
‼️ Tip!
Using these kind of map options, limits the use of the map to a great extent! When using a paid subscription plan on a tile provider this can be very useful. But also the IX design can be improved with these settings. People are directed to what you want to show them on the map and cannot “get lost” or use the map for different purposes. So do not forget about what you want the user to see and use these map options! :)
Adding our Maptiler map to Maplibre
Go back to the Maptiler page and go to your own style map overview page.
When you scroll down a bit you will see links that we can use in our own web page.
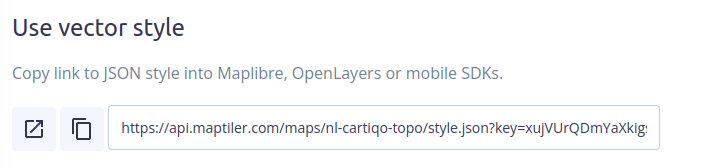
Copy the Vector Style link
For example, mine looks like this:
https://api.maptiler.com/maps/niene-style/style.json?key=<MyAPIkey>
Now paste this link into the style option of your map, like so:
var map = new maplibregl.Map({
    container: 'map', // container id
    style: 'https://api.maptiler.com/maps/niene-style/style.json?key=<MyAPIkey>', // style URL
    center: [0, 0], // starting position [lng, lat]
    zoom: 1, // starting zoom
    hash: true
});
Check your map, do you see your own style?
User Interface controls
While with Leaflet the hash was a separate plug-in, Maplibre provides these already. On the other hand, a basic map in Maplibre does not contain the controls by default as Leaflet does. So let’s add these:
Add navigation control to the map, showing zoom buttons:
let nav = new maplibregl.NavigationControl();
map.addControl(nav, 'top-left');
You do this by pasting this code below the map object in the JS file.
Then, AttributionControl gives options for showing and defining the small source reference at the bottom of the map. If no attribution is given in the map’s style we can provide one ourselves. Also we can overrule the attribution control provided by the style.
In the map options we set {attributionControl: false} and then we add a new attribution control:
let map = new maplibregl.Map({attributionControl: false})
    .addControl(new maplibregl.AttributionControl({
        compact: true
    }));
There is also a button for displaying a full screen map:
map.addControl(new maplibregl.FullscreenControl({container: document.querySelector('body')}));
More options you can find in the documentation
Use the documentation te see what more you would like to add.
Problems with the web page?
Use the Web Console.
In your browser when you opened your HTML page click with your right mouse button, choose : Inspect Element
Or Press F12
The web inspector shows you the content of your page and the current state of the DOM. DOM stands for Document Object Model and refers to the hierarchical structure of HTML. Web browsers parse the DOM in order to make sense of a page’s content.
Go to the Inspector, Do you see the same content as we just made in our text editor?
Just have a look around. Nothing can happen!
The Console logs any errors or comments!
Go to the tab Web Console to see if it reports anything useful for you.
Fix your problems!
Put your map online
Put your map online with the Hosting on Github tutorial!
You reached the end of this workshop!