


Making a Web Map with Leaflet.js
the workshop starts here
Leaflet is an open-source JavaScript library for interactive web maps. It’s lightweight, simple, and flexible, and is probably one of the most most popular open-source mapping library at the moment.
In Part one we will set up the basics to show a standard background map with Leaflet.
In Part two we will add markers, circles and polygons to our map.
In Part three we will change the projection to RDNew(EPSG:28992) and add a WMS service from the CBS.
In Part four we will set up a local server and add a GeoJSON file containing geo-spatial data to our map.
![]()
Leaflet creates “Slippy” maps with raster tiled base layers, user interaction like panning and zooming, and feature layers that you supply. It handles various basic tasks like converting data to map layers and mouse interactions, and it’s easy to extend with plug-ins. It will also work well across most types of devices. Leaflet is developed by Vladimir Agafonkin (currently of MapBox) and other contributors.
JavaScript Library
Including a JavaScript library in your code is like copying and pasting someone else’s code into yours. You have access to everything in that library. In our case, it’s a bunch of cool tools to make web maps and give them familiar functionality.
Preparation
Goal
At the end of this workshop, you will have your own web page with an interactive map! Including some custom data and different background maps, zoomed in on the area you want to show! Your web page will be hosted on Github, so you can immediately share your progress of the day with all your family and friends!
Beginners
You need to know a little about: HTML, CSS & JS.
If you are not that comfortable with HTML, CSS and JavaScript yet, this short Making a Web Page tutorial will help you along!
Or do some online courses like the ones on Code Academy
What do you need?
Your laptop with:
- a web browser, like Firefox, Chrome or Safari.
- a proper text editor, like Visual Studio Code , Nodepad ++, SublimeText or Brackets with Syntax Highlighting.
- Internet
Syntax Highlighting
Syntax highlighting is a feature of text editors that are used for programming, scripting, or mark-up languages, such as HTML. It displays text, especially source code, in different colours and fonts according to the category of terms to make them more visually distinct. Highlighting does not affect the meaning of the text itself; it is intended only for human readers.
Setting up:
On your computer create a directory for yourself, where we can work in today. For example:
/home/niene/Documents/MyFirstWebMap_Leaflet
We’ll save everything we make and download today in this directory. During this workshop it is referred to as 📂yourDirectory.
Part 1
In Leaflet part 1 we will set up the basics to show a standard background map with Leaflet.
If you are not that comfortable with HTML, CSS and JavaScript yet, this short Making a Web Page workshop will help you along! Do this first and then come back here.
If you already know some HTML, CSS and JavaScript, you can start here and read through the HTML explanations.
Setting up the basics
Open your text editor.
Create an empty file to make your basic HTML page. Copy the following into your file:
<!DOCTYPE html>
  <html>
    <head>
      <title> My title </title>
    </head>
  <body>
    <H1>Example</H1>
  </body>
</html>
Save the file in yourDirectory and call the file index.html.
The syntax highlighting will become active as soon as you save your file as a
.htmlfile .
In the document, change the title to “My first Leaflet map".
Place a <div> in the <body>
<div id="map"></div>
The <div> is a kind of frame where our map will come! This frame does not contain anything yet. We will have to give it some dimensions in order to show content. We will specify the width and height with CSS, so the <div> can be seen. Later, we will give content to the <div> with JavaScript. To be able to do that, we will need its id to be able to reference it.
Open a new file and save this as main.css in yourDirectory.
With CSS we will style our <div> object. In the main.css we will reference to the <div> with a “#map” selector which indicates a object with the id="map" in the HTML. Now set the rule height (and optional width).
Copy this into your CSS file:
#map {
  height: 500px;
  width:100%;
}
Change the amount of pixels and/or percentage to the map size you prefer.
We do not see anything yet, because we need to reference our CSS file in our HTML file to become active. We now put the link in our HTML file:
Go back to your index.html file and put the link to your CSS file in the <head>.
<link rel="stylesheet" href="main.css"/>
Now we will add the JavaScrip Library Leaflet.js.
Go to http://leafletjs.com/download.html to use the Hosted Version of Leaflet.
Scroll down and copy the link of the newest leaflet library release:
<link rel="stylesheet" href="https://unpkg.com/leaflet@1.7.1/dist/leaflet.css" />
<script src="https://unpkg.com/leaflet@1.7.1/dist/leaflet.js"></script>
Place the leaflet.css Link in the <head> of your html file.
Place the leaflet.js script library in the <body>.
By including the online link to the library, the browser includes it and the Leaflet functions are now available for us to use througout the whole website. CSS goes in the <head> , scripts go in the <body>
Now you will have:
<!doctype html>
<html>
  <head>
    <title>My first Leaflet map</title>
    <link rel="stylesheet" href="https://unpkg.com/leaflet@1.7.1/dist/leaflet.css" />
    <link rel="stylesheet" href="main.css"/>
  </head>
  <body>
    <H1>example</H1>
    <div id="map"></div>
    <script src="https://unpkg.com/leaflet@1.7.1/dist/leaflet.js"></script>
  </body>
</html>
The basics are done!
Web maps
Web maps are made up of many small, square images called tiles. These tiles are typically 256x256 pixels and are placed side-by-side in order to create the illusion of a very large seamless image. A big advantage: all these little tiles load way faster than one big map! This kind of map is called a “Slippy” map.

Each zoom level has its own set of tiles. Zoom level 0 has 1 tile for the world. With each additional zoom level, the number of tiles increases exponentially. So zoom level 1 has 4 tiles for the world. Zoom level 2 has 16 tiles for the world ect.
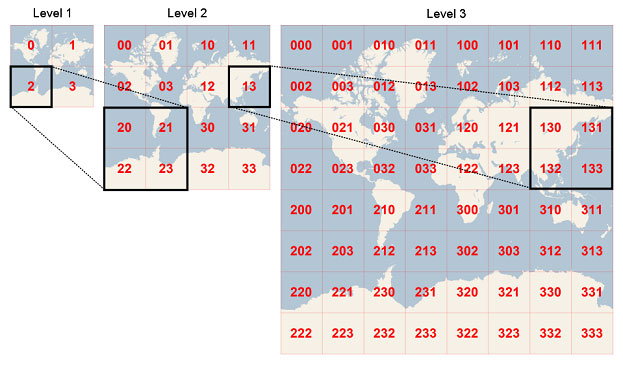
As you can see, map tiles are static raster images on the web. These tiles need to live somewhere on the web page.
A url for a tile set may look like this. Where the z is the zoom level, and the x and y the position in the grid.
http://{s}.basemaps.cartocdn.com/light_all/{z}/{x}/{y}.png
But how do you know when to load which tile and how do they react when you click or drag? Leaflet is a JavaScript library that allows us to do just that.
Making the Leaflet map
In order to use Leaflet we need some JavaScript code. This takes care of all the interactive functionality. Let’s see how a Leaflet map in initialized.
Create a <script> object in your HTML:
<script>
 // all your code goes here!
</script>
Initialize a Leaflet Map object and assign it to our <div id="map>
<script>
  //initialize the map
  const map = L.map('map').setView([51.9741, 5.6688], 15);
  );
</script>
const map = L.map("map") initializes the map variable. The L. is for Leaflet library. The .map is a function comming from the Leaflet library.
Storing the Leaflet map into a const variable map makes sure we can reference to our map object later on in the code through map.
The function L.map("map") takes one argument: "map". This links it to our <div id="map"></div>. So the map content is loaded in the <div> content.
setView() centres the map ([latitude, longitude], zoom level). The projection is Google Mercator.
Adding a base layer
A base layer is the reference map of your map application. This layer consists of the multiple PNG images, so-called ’tiles’, which are quick to load!
Make a base layer and save it to a constant called backgroundmap:
<script>
  //initialize the map
  const map = L.map('map').setView([51.9741, 5.6688], 15);

  //Create baselayer - tiles
  const backgroundMap = L.tileLayer('http://{s}.basemaps.cartocdn.com/light_all/{z}/{x}/{y}.png',{
    attribution: '<a href="http://openstreetmap.org">OpenStreetMap</a>contributors, <a href="http://creativecommons.org/licenses/by-sa/2.0/">CC-BY-SA</a>',
    maxZoom: 19
    }
  );

  backgroundMap.addTo(map);
</script>
With L.tileLayer('http://...') we graps some tiles from the internet and assign it to a Leaflet tile layer object.
backgroundMap.addTo() adds the tile layer to the map. Do not forget this!
Now you have made your first web map!
Open your index.html file in your browser!
Do you see your map? Great!
‼️ you do not see a map?
Open the debugger
- Click with your right mouse button, choose :
Inspect Element- Or Press F12
The debugger shows you the content of your page. But also logs any errors or comments! Go to the tab
Web Consoleto see if it reports anything useful for you.Do you get:
ReferenceError: L is not definedThen shuffle around the order in your script. Put the
leaflet.js scriptabove your custom script!
Customizing
Play around with your map to practice using different tiles, coordinates and zoom levels. For example make the map suite your own project you are currently working on.
Different tiles
There are many different tile providers! Just copy their example code, replacing your own code starting from L.tileLayer (... ); Have a look at this Leaflet provider preview application.
Try out some different styles in your map!
Initial position and zoom level
Set the initial zoom level and center location of your map to the project area you are currently working on.
Looking for a specific place to centre on? Find your coordinates here: mapcoordinates.net
Plug-in Hash
Leaflet.js contains only the most basic task for making a web map. That why it is so light-weight and fast. Ideal for small maps on mobile applications with limited internet access.
If you want to have more elaborate functionality in your map we will need to add plugins.
A useful (and small) plugin for example is Leaflet-hash plugin. This plugin shows the position of your web map in the url of your web page. It gives the z: zoom level and the x and y coordinate. Now you can always return to the map where you last opened it, or share a specific location with someone else!
Let’s add this plug-in to your map!
<script src="https://cdnjs.cloudflare.com/ajax/libs/leaflet-hash/0.2.1/leaflet-hash.js"></script>
Add the Leaflet-hash plugin to your page by adding the <script> tag in the html, just below the Leaflet library.
In your custom code we will add the hash to our map. Put the code under the map variable:
// Hash in URL
const hash = new L.Hash(map);
Refresh your browser! Do you see the z/x/y position of the map at the end of the url?
‼️ NOTE!
The inital
z/x/ymap position set in your code only works when initializing the map for the first time. Refreshing the browser with thez/x/yhash in the url will re-open the map at this last location, not the inital location you set in your code!If you want to go back to your original location set in your code, remove the
z/x/yhash from the url to refresh the map.
Part 2
In part 2 we will add markers, circles and polygons to our map.
Our reference map consists of multiple tiles: static raster images. If you zoom or pan the map, new raster images are loaded into view.
In this step, we will use native Leaflet JS functionality to draw markers, circles and polygons: vector objects. If you zoom or pan the map, these vector objects simply scale or move along.
Vector Data vs Raster data
Raster data is like a picture that you would take with a digital camera: at the lowest level of abstraction, it is a list of pixels with values. When you ‘zoom in’ and look closer at raster data using an image viewer application, at some point you’ll see these discrete pixels, and it will look pixelated.
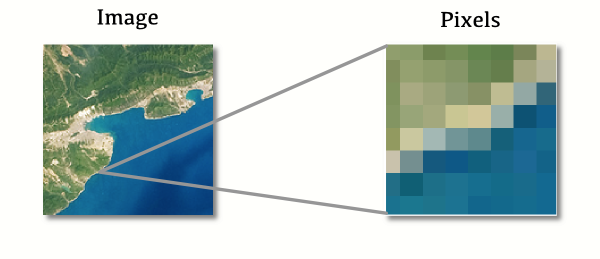
Vector data stores basic geometries rather than pixel data. No matter how much you ‘zoom in’ on vector data, you won’t see pixels: the data stored is composed of geometric points and lines, and only converted into an image when necessary.
Loading in vector data to your map is much more extensive (for your computer) then raster data. Because it contains all the data on coordinates and attributions, depending also on how elaborate your geo data is. A set of points is already much smaller in size then a set of highly detailed polygons.
Therefore it is wise to only add a limited amount of vector data to your web map. Otherwise you will use too much loading time, making your map slow, or even the browser could die of too much data being loaded..
Markers, circles and polygons
Now we will add custom markers, circles and polygons to your map. (for example your home address).
Add the following to your Javascript:
let marker = L.marker([51.98514, 5.66647]).addTo(map);
JS
letstands for variable. Variables store data so that they can be used later on in the program. We also saw aconstvariable. Aletvariable can be reassigned and aconstcannot be reassigned.
Here the keyword let creates a new variable named marker. The value stored is a Leaflet marker which is immediately added to our map.
Add another 4 markers. (friends, places you lived or visited?). Note: give the let another name every time. Example:
let forum = L.marker([ 51.98531, 5.66361]).addTo(map);
Provide the markers with a pop-up. For the Forum we add the following pop-up:
let popup = "Write your pop up text here";
forum.bindPopup(popup);
JS Did you notice a
;at the end of every statement? The semicolon tells the computer that the statement has ended.
Now place a circle on the map, use your own coordinates:
let circle =  L.circle([51.98531, 5.66361], 500, {
  color: 'red',
  fillColor: '#f03',
  fillOpacity: 0.5
}).addTo(map);
Connect all previous markers with a polygon. Use all previous coordinates and combine them in the right order.
let polygon = L.polygon(
  [[
    [51.98675, 5.66554],
    [51.9875, 5.66832],
    [51.98825, 5.66778],
    [51.98779, 5.66602],
    [51.98784, 5.66591],
    [51.98758, 5.66501],
    [51.98753, 5.66498],
    [51.98675, 5.66554]
  ]]).addTo(map);
Your script should look like the following:
<script>
   //initialize the map
        const map = L.map('map').setView([51.9741, 5.6688], 15);

        //Create baselayer - tegels
        const backgroundMap = L.tileLayer('http://{s}.basemaps.cartocdn.com/light_all/{z}/{x}/{y}.png', {
            attribution: '<a href="http://openstreetmap.org">OpenStreetMap</a>contributors, <a href="http://creativecommons.org/licenses/by-sa/2.0/">CC-BY-SA</a>',
            maxZoom: 19
        }
        );
        // Add base layer to map.
        backgroundMap.addTo(map);

        // Hash in URL
        const hash = new L.Hash(map);

        //Add markers
        let forum = L.marker([ 51.98531, 5.66361]);
        forum.addTo(map);

        let atlas = L.marker([ 51.9864, 5.66801]);
        atlas.addTo(map);

        let uni = L.marker([ 51.98514, 5.66647]);
        uni.addTo(map);

        //Add pop-ups
        let popup = "The Forum Building.";
        forum.bindPopup(popup);

        let popup1 = "The atlas building";
        atlas.bindPopup(popup1)

        let popup2 = "What building is this? ";
        uni.bindPopup(popup2);

        //add a circle
        let circle = L.circle([51.98531, 5.66361], 500, {
            color: 'red',
            fillColor: '#f03',
            fillOpacity: 0.5
        }).addTo(map);

        //add a polygon
        let polygon = L.polygon(
            {{ < ref "#
            [51.98675, 5.66554],
            [51.9875, 5.66832],
            [51.98825, 5.66778],
            [51.98779, 5.66602],
            [51.98784, 5.66591],
            [51.98758, 5.66501],
            [51.98753, 5.66498],
            [51.98675, 5.66554" > }}]).addTo(map);
</script>
JS The double slashes
//mark a Single line comment. Any text between//and the end of the line will be ignored by JavaScript (will not be executed). JavaScript comments can be used to explain JavaScript code, and to make it more readable.
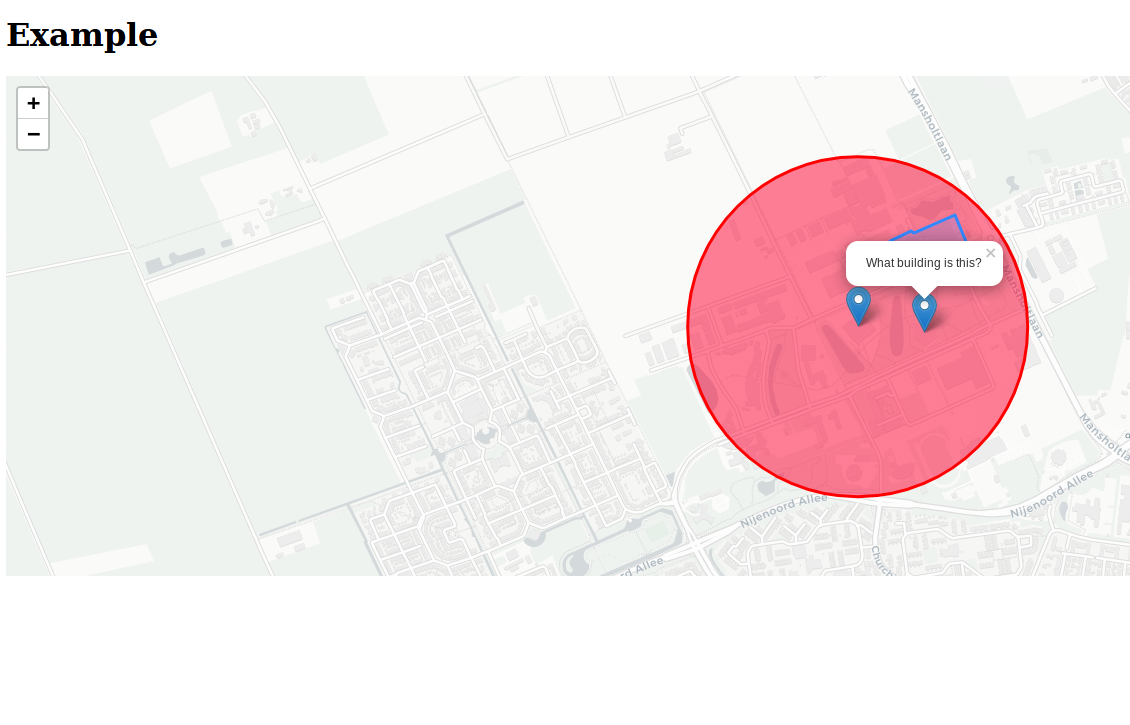
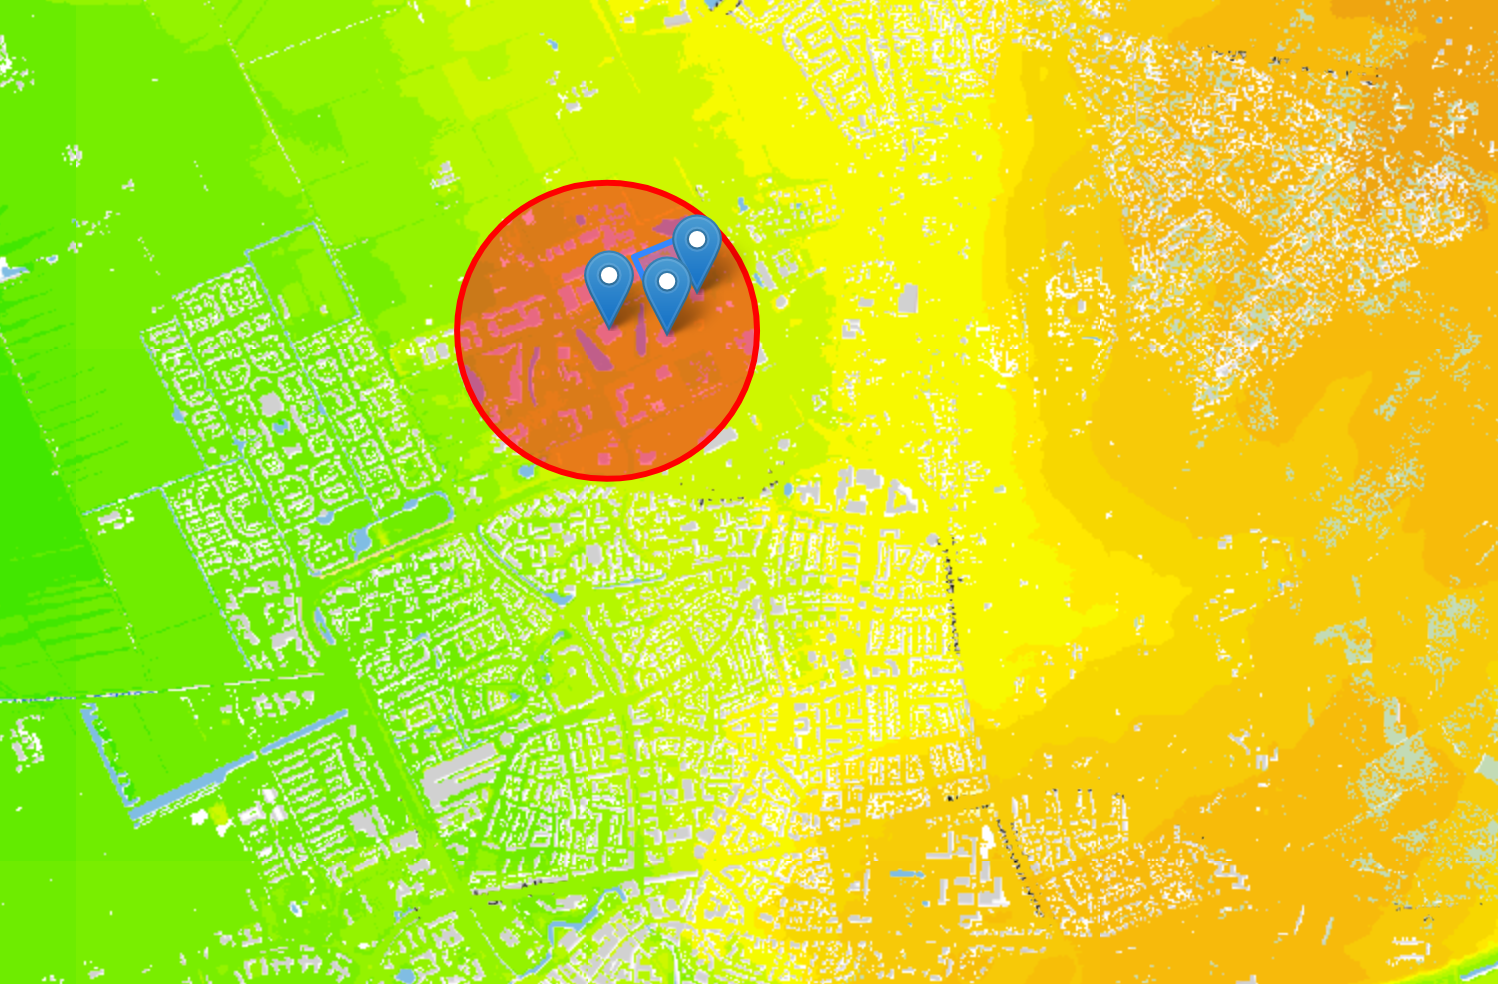
Have a look in your browser to see if you see all your markers and circles are on the map! If not, adjust the zoom and/or centre settings or change your coordinates!
Also check the debugger in the browser to see if everything is correct: F12
This is what my example looks like:
Part 3
In this step we will change the map projection and add some Dutch reference maps.
Changing the projection
Publieke Dienstverlening Op de Kaart (PDOK) (or Public Service on the Map) is a Dutch government initiative to provide a wide range of geographic web services. Many of these services provide data sets that are available under an open license. Typically, you would use a desktop GIS application or the OpenLayers JavaScript library to use these services. This is the where the Open Geospatial Consortium (OGC) standards for geographic web services were first implemented. Nevertheless, there are a number of ways you can just as well use Leaflet to consume these geographic web services for your online mapping application and leverage the potential of the wealth of data available from PDOK.
There is one caveat: maps from Google, Bing, OpenStreetMap come in the Web Mercator projection, whereas for the Netherlands the projection used is Rijksdriehoekstelsel (RD) or Amersfoort New. Each spatial reference system is identified by a code. The code for Web Mercator is EPSG:3857. The code for Amersfoort New is EPSG:28992. A third spatial reference system to keep in mind is WGS-84, the coordinates used by GPS systems that are recorded in longitude and latitude, identified by the code EPSG:4326.
The geographic web services from PDOK come in the Amersfoort RDNew projection by default, whereas Leaflet expects map tiles in the Web Mercator projection. Furthermore, the zoom levels for the Dutch tiling scheme are at different map scales.
So lets change our Leaflet map projection to RDNew! We need some extra plugins to do the heavy lifting for us, Proj4js and Proj4Leaflet:
<script src="https://cdnjs.cloudflare.com/ajax/libs/proj4js/2.7.5/proj4.js"></script>
<script src="https://cdnjs.cloudflare.com/ajax/libs/proj4leaflet/1.0.2/proj4leaflet.js"></script>
Add the plugins libraries to your html code in the <body> , after the leaflet library:
<body>
    <h1>Example</h1>
    <div id="map"></div>
    <script src="https://unpkg.com/leaflet@1.7.1/dist/leaflet.js"></script>
    <script src="https://cdnjs.cloudflare.com/ajax/libs/leaflet-hash/0.2.1/leaflet-hash.js"></script>
    <script src="https://cdnjs.cloudflare.com/ajax/libs/proj4js/2.7.5/proj4.js"></script>
    <script src="https://cdnjs.cloudflare.com/ajax/libs/proj4leaflet/1.0.2/proj4leaflet.js"></script>
    <script>
            //...
    </script>
</body>
Now, we can define the projection and the Dutch tiling scheme in our own code.
Add the following code to your script:
 const RDnew = new L.Proj.CRS('EPSG:28992', '+proj=sterea +lat_0=52.15616055555555 +lon_0=5.38763888888889 +k=0.9999079 +x_0=155000 +y_0=463000 +ellps=bessel +units=m +towgs84=565.2369,50.0087,465.658,-0.406857330322398,0.350732676542563,-1.8703473836068,4.0812 +no_defs',
    {
        transformation: L.Transformation(-1, -1, 0, 0),
        resolutions: [3440.640, 1720.320, 860.160, 430.080, 215.040, 107.520, 53.760, 26.880, 13.440, 6.720, 3.360, 1.680, 0.840, 0.420],
        origin: [-285401.920, 903401.920],
        bounds: L.bounds([-285401.920, 903401.920], [595401.920, 22598.080])
    }
);
With const RDnew = L.Proj.CRS we make a variable with a new Coordinate Reference System.
The string we give is the official definition of the Rijksdriehoekstelsel. See also the official documentation on EPSG
at resolutions are the scales per zoom level. (Which are different then the webmercator scales and zoom levels!! ) so we define 14 zoom levels here. For a comparison between Webmercator and RDNew zoom levels and scales you can have a look here
Now we only have to tell our map to use the custom defined Coordinate reference system.
Add the option of the CRS to your map object and point it to the RDnew variable.
const map = L.map('map', {
    crs: RDnew,
    zoom: 12, //Zoom scale RD new
    center: [51.9741, 5.6688] //webmercator coördinaten
});
NOTE! The map will use the zoom levels of the RDnew projection but the coordinates of the center are still in Web Mercator. Leaflet will solve this automagically ✨.
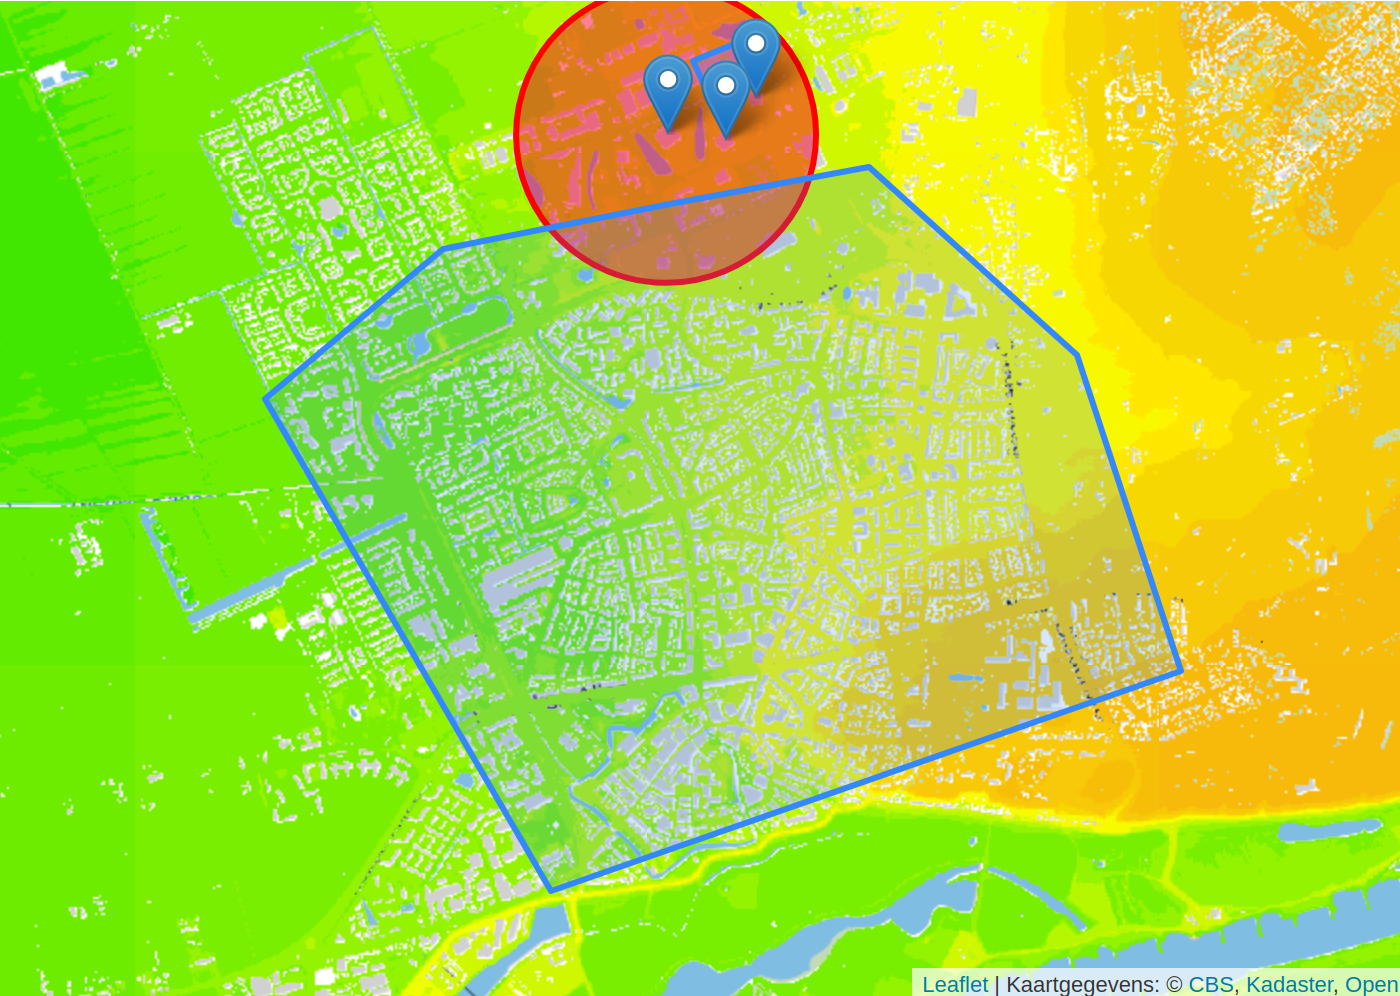
Now we are ready to use a background map of PDOK, instead of the Open Street Map background. We’re all set to add the reference map BRT Achtergrondkaart from PDOK using the WMTS protocol.
Remove the OSM background map we used before.
Add the BRT backgroundmap to your map.
const pdokachtergrondkaart = new L.TileLayer('https://service.pdok.nl/brt/achtergrondkaart/wmts/v2_0/standaard/EPSG:28992/{z}/{x}/{y}.png', {
    minZoom: 0,
    maxZoom: 13,
    attribution: 'Kaartgegevens: © <a href="http://www.cbs.nl">CBS</a>, <a href="http://www.kadaster.nl">Kadaster</a>, <a href="http://openstreetmap.org">OpenStreetMap</a><span class="printhide">-auteurs (<a href="http://creativecommons.org/licenses/by-sa/2.0/">CC-BY-SA</a>).</span>'
});

pdokachtergrondkaart.addTo(map);
Refresh your browser.
Adjust the zoom level to match with your chosen view again.
PDOK provides a few styles of the map:
- grijs
- kleur
- pastel
- water
See the PDOK website for all the available tile urls.
Which map do you want to use?
‼️ Did you see that your markers, circle and polygon are still on the right location? Even though you gave the coordinates in WGS84 system. Leaflet transforms these coordinates on the fly! How awesome is that?! ✨
Adding a WMS
WMS, short for web map service, is a popular way of publishing maps by professional GIS software (and seldomly used by non-GISers). This format is similar to map tiles, but more generic and not so well optimized for use in web maps. A WMS image is defined by the coordinates of its corners - a calculation that Leaflet does under the hood.
PDOK publishes also the AHN data as WMS and WFS services. Have a look at https://www.pdok.nl/geo-services/-/article/actueel-hoogtebestand-nederland-ahn3- .
When a WMS is published it usually comes with a ‘GetCapabilities’ document, which describes which data layers and styles are available in the service.
For example, have a look at the AHN3 WMS data.
https://geodata.nationaalgeoregister.nl/ahn3/wms?request=GetCapabilities&service=wms
There is just one AHN layer available and the page index:
ahn3_5m_dtmahn3_bladindex
Per LAYER there is a STYLE available.
Find the AHN dataset in the getCapabilities file, just have a look at the file.
Now add the WMS layer to your map. Replace the styles parameter with the style layer you want to add:
// ADD a WMS layer
const cbs = L.tileLayer.wms('https://geodata.nationaalgeoregister.nl/ahn3/wms', {
        'layers': 'ahn3_5m_dtm',
        'styles': 'ahn3:ahn3_5m_detail',
        'srs': 'EPSG:28992',
        'format': 'image/png',
        'transparent': true
    }).addTo(map);
The WMS layer is added to the top of our map. This is how it could look like:
If you want the layer to be a bit more transparent add the following line to the tilelayer properties:
`opacity': 0.5`
Part 4
In Leaflet part 4 we will add a GeoJSON file containing geo-spatial data to our map.
GeoJSON
GeoJSON is the standard data type to create web maps with. JSON stands for JavaScript Object Notation. GeoJSON is a format for encoding a variety of geographic data structures. It’s also fairly human readable if you open it in a text editor. A geoJSON file or object can be added as another map layer with Leaflet.
This is what a point feature looks like:
{
  "type": "Feature",
  "geometry": {
    "type": "Point",
    "coordinates": [125.6, 10.1]
  },
  "properties": {
    "name": "Dinagat Islands"
  }
}
geojson.io is a nice website where you can draw and validate a GeoJSON object.
Go to geojson.io and draw a simple(!) polygon in Wageningen. Make it simple because every click is a set of extra coordinates and we don’t want our data to become too big!
This is my GeoJSON polygon:
{
  "type": "FeatureCollection",
  "features": [
    {
      "type": "Feature",
      "properties": {},
      "geometry": {
        "type": "Polygon",
        "coordinates": [
          [
            [
              5.664052963256836,
              51.983241434598284
            ],
            [
              5.65272331237793,
              51.98186699036
            ],
            [
              5.64396858215332,
              51.97737332064479
            ],
            [
              5.657873153686523,
              51.96246168188569
            ],
            [
              5.688686370849609,
              51.9690720630921
            ],
            [
              5.683708190917969,
              51.97864216717502
            ],
            [
              5.673494338989258,
              51.98429867069855
            ],
            [
              5.664052963256836,
              51.983241434598284
            ]
          ]
        ]
      }
    }
  ]
}
The GeoJSON file starts with defining its type and features. The type is a FeatureCollection, meaning it can contain multiple geometries of type, point, line and polygons combined.
All the geometries are in the features array. The array starts with a square bracket [ and closes with ]. Here we only have one polygon in our features array.
Per feature, there is a type, properties and the geometry. In the properties you are free to define your own attributes like a name, type, function ar any kind of data you have about the feature.
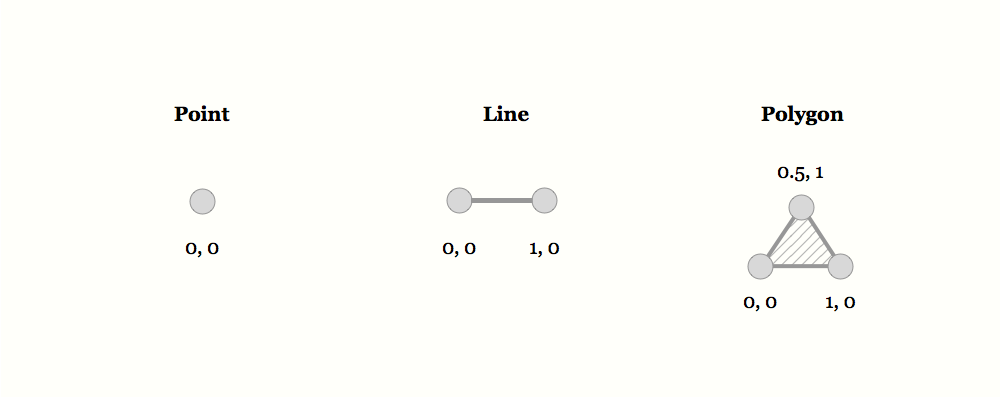
GeoJSON supports the following geometry types: Point, LineString, Polygon, MultiPoint, MultiLineString, and MultiPolygon. Geometric objects with additional properties are Feature objects. Sets of features are contained by FeatureCollection objects.
It uses the World Geodetic System 1984, and units of decimal degrees.
The GeoJSON format specification can be found here and here.
Adding a inline GeoJSON to the map
Let’s add this simple feature to our map. We can just put it in our code.
Copy your GeoJSON object in your code. Make sure to declare it a variable by giving it a name:
const myGeojson = {
 "type": "FeatureCollection",
  "features": [
    // ...
  ]
}
Add the GeoJSON layer to your map. Place this after the map definition.
// ADD the geoJSON Layer
L.geoJSON(myGeojson).addTo(map);
Check your map to see the polygon. Leaflet gives the polygon a default style.
‼️ So what if you have your own dataset, containing many features? If we put this all inline in our code it is going to look like a mess. Your code will become huge and unreadable. Therefore, in the next step, we will learn how to add a separate file with data to our map.
Adding a separate file GeoJSON to the map
Using your own data
Feel free to use any of your own data of your project. In this workshop we will add some points to the map. So if you have a small dataset of points of your own, that would be easiest to use.
Open your dataset in Qgis and make sure:
- Save your data as a .geojson file
- Geometries stored in WGS84 coordinate system.
- Put the coordinate precision to 5, to keep your file to a reasonable size!
- use one geometry type at a time.
Test your geojson on geojson.io to see if you have a valid geojson file!
Place the file in yourDirectory next to your html file!
Using our sample dataset
From the dataset about traffic accidents we extracted a small part of Wageningen.
Download the traffic accidents dataset of Wageningen.
Or the bike data from 2015.
Have a look at the file in your browser or text editor. Do you see how it is build up? It is a lot of notations!
Right click: Save Page As...
Place the geojson file in yourDirectory next to your html file!
‼️ Before we can acces the geojson file in our browser, we first need to do one more thing..
Running a local server
When developing a website, a web designer needs to be able to see his webpages the same way the end user would. Sometimes simply clicking on and viewing your HTML files in the web browser is enough, but if you want to test dynamic content, you will need to set up a local web server. Doing this is quite simple and can easily be accomplished on Windows, Mac, and Linux. There are many types of web servers available, but we will be using the Python’s SimpleHTTPServer as it is very easy to set up.
If we want to add a separate data file to our own map, we need to run a local server in your working directory.
- Open a command prompt/ terminal.
- Navigate to your working directory
- Run a local server
python -m SimpleHTTPServer [port]
- Go to localhost:8000/index.html in your browser.
If you do not know how to do this then follow the Running a local server workshop first!
Is the server running? In the right place? Then we can add the code.
Adding a GeoJSON layer to Leaflet.
First we will define the style for our geojson markers in our code. The sample data exists out of points which we will style as circles. If you have another kind of geometry, check the Leaflet documentation on how the add your style.
This bit of code, defines a circle marker style for our points that we add later.
Copy the code between your <script> tags and after your previous code.
// Create a marker style
const geojsonMarkerOptions = {
  radius: 8,
  fillColor: "#ff7800",
  color: "#000",
  weight: 1,
  opacity: 1,
  fillOpacity: 0.8
};
This creates a object geojsonMarkerOptions with the properties that define the marker style. The circle will be 8 pixels in radius and orange of color.
GeoJSON objects are added to the map through a GeoJSON layer. To create it and add it to a map, we use the following code:
L.geoJSON(geojsonFeature, properties).addTo(map);
Alternatively, we could create an empty GeoJSON layer and assign it to a variable so that we can add more features to it later.
const myLayer = L.geoJSON().addTo(map);
myLayer.addData(geojsonFeature);
In our example we create a empty geoJSON layer but do define some properties for it already!
Create an empty geojson layer by adding the following code:
//create a empty geojson layer
const geojson = L.geoJson(null,{
  pointToLayer: function (feature, latlng) {
    return L.circleMarker(latlng, geojsonMarkerOptions);
  }
})

geojson.addTo(map);
The pointToLayer is a function defining how the GeoJSON points are transformed to a Leaflet layer. It is internally called when data is added, passing the GeoJSON point feature and its LatLng. The default is to spawn a default Marker:
function(geoJsonPoint, latlng) {
  return L.marker(latlng);
}
Instead of the default, we spawn a L.circleMarker here with our predefined options that are stored in the geojsonMarkerOptions object.
Now it is time to add the real data to our GeoJSON object, because there is nothing to see yet!
Get the GeoJSON file with a Fetch promise
Fetch provides a functionality to Request and Response objects over a network. (This kind of functionality was previously achieved using XMLHttpRequest.)
Here we are fetching a JSON file across our local network. But it works the same as if you are fetching a file across the internet.
The simplest use of fetch() takes one argument — the path to the resource you want to fetch — and returns a promise containing the response (a Response object).
Copy the following code between your <script> tags and after your previous code.
// Fetch the geojson file
fetch("./BikeData_2015.geojson")
    .then(response => response.json())
    .then(data => {
        geojson.addData(data);
    })
So let’s have a look if it worked:
Refresh your localhost:8000/index.html page. Do you see your data?
Error handling
A Fetch can also do some error handling in case your request goes wrong. Add a catch function to the code to catch the error and alert it. If your code is correct you won’t see any change. But if your file is not correctly fetched, the error will be alerted. This makes your code more neat!
Add the catch function. Make your fetch path wrong (just add some spaces to the document title) and see what happens.
// Fetch the geojson file
fetch("./BikeData_2015.geojson")
    .then(response => response.json())
    .then(data => {
        geojson.addData(data);
    })
    .catch( error => alert("Sorry, the data cannot be found, this is the error: " + error))
Fetch the data directly
The following is also working without a local server because we directly get the data from a https address.
// Fetch the geojson file
 fetch("https://raw.githubusercontent.com/NieneB/webmapping_for_beginners_v2/master/leaflet-part-4/trafic_accidents_wageningen_2017.geojson")
    .then(response => response.json())
    .then(data => {
        geojson.addData(data);
    })
    .catch( error => alert(error))
Do you have any data online? See if you can replace the url with another dataset. Make sure it is a valid geoJSON!
Data driven styling
In order to make our style dependent on the data we have to create a style function instead of an object.
In this code the circle marker radius will depend on a attribute field: AANTAL (the amount of bikes passing).
This will be the function. See that we can just access the feature.properties.attribute_name
The function will review all the features and apply a adjusted style per feature.
 // Create a marker function
function geojsonMarkerFunction(feature) {
  return {
    radius: Math.log(feature.properties.AANTAL) +2,
    fillColor: "#ff7800",
    color: "#000",
    weight: 1,
    opacity: 1,
    fillOpacity: 0.8
  }
};
Now in our GeoJSON layer we assign the style function to our circles. We have to call the geojsonMarkerFunction function with the (feature) between the brackets. This means a function is executed taking a input of feature. So all our features are styled individually!
//create a empty geojson layer
const geojson = L.geoJson(null, {
    pointToLayer: function (feature, latlng) {
        return L.circleMarker(latlng, geojsonMarkerFunction(feature));
    }
}).addTo(map);
Put your map online with the Hosting on Github tutorial!
You reached the end of this workshop!