3 - Create Your Own Data - DAE
the workshop starts here
In this workshop, you will learn how to create and edit your own dataset.
This workshop assumes that you have completed the workshop QGIS 2 - Data Analysis and continues where that one left off.
This workshop was created using QGIS version: 3.14.16-PI
Create a Layer from scratch
In the menu, go to Layer > Create Layer > New Geopackage Layer. A new window will open.
Click the ... next to the database field to save the file in your 📂 working folder. Name the layer.
We will practice drawing polygons. Set the Geometry type to polygon.
Add a Field. These are the attributes (properties) of your new dataset. Fill in the values under New Field and click the Add to Field List button. The field will now appear in the Field List. Come up with at least two pairs of attributes. For example: name, area. Pay close attention to the data type you assign. Use at least two different data types.
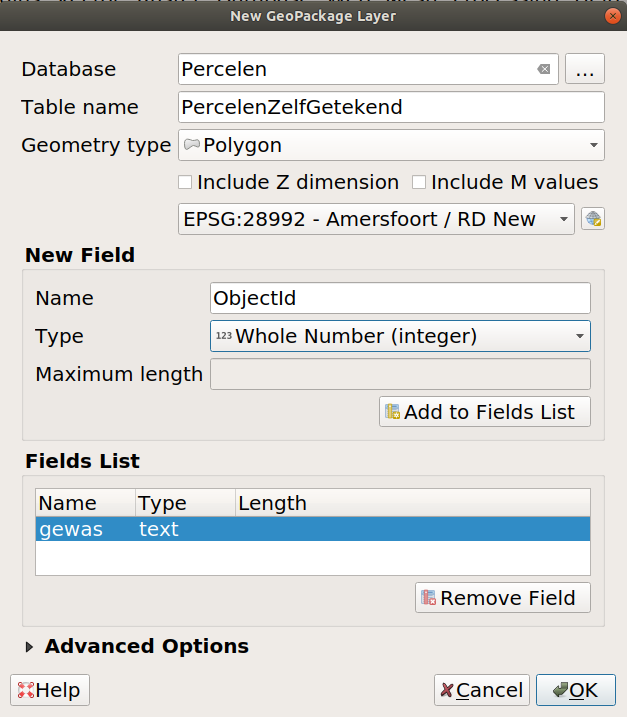
Click Ok.
The new layer will automatically appear among the Layers. Of course, we don’t see anything because the layer is still empty. We need to fill it with new features. In the next steps, we will learn how to draw them.
Digitizing Toolbar
Enable the Digitizing toolbar. View > Toolbars > Digitizing toolbar.

Turn on the Edit mode on the new layer by selecting the PercelenZelfgetekend layer in the Layers panel first and then click on the yellow pencil in the Digitizing toolbar.
You can also enable edit mode by right-clicking on the PercelenZelfgetekend > Toggle editing.
The icon for the PercelenZelfgetekend layer will now change to a yellow pencil. This shows that you are editing this layer.
Now that edit mode is on, we are almost ready to start drawing polygons. But first, let’s turn on snapping.
Snapping
When creating a new feature or modifying an existing one, snapping can be very useful. Snapping ensures that a vertex point you create (or move) binds to the nearest vertex in the existing data. The Snapping tolerance is the distance within which snapping works.
The easiest way to understand it is by trying it out.
Enable the Snapping toolbar. In the menu, go to View > Toolbars > Snapping toolbar.

Enable snapping by clicking the horseshoe icon.
Change the tolerance to 10 meters.
We will now try to create and draw a feature.
Drawing Polygon
In the Digitizing toolbar, click on Add Polygon Feature.

Move your mouse over the BRP parcels on the map. Do you see the purple square neatly aligning with a vertex of a BRP parcel?
If you place the cursor within 10 meters of an existing vertex point in the data, the cursor snaps to it. If you now click to draw the polygon, you’re using the exact same coordinate point! This ensures the quality of the dataset.
Try tracing a parcel completely. Right-click to finish the polygon. QGIS will now ask you to fill in the related fields. Create a few values.
Save the edits by clicking this  icon in the Digitizing toolbar.
Draw a few more polygons and come up with values. Don’t forget to save the edits regularly. 
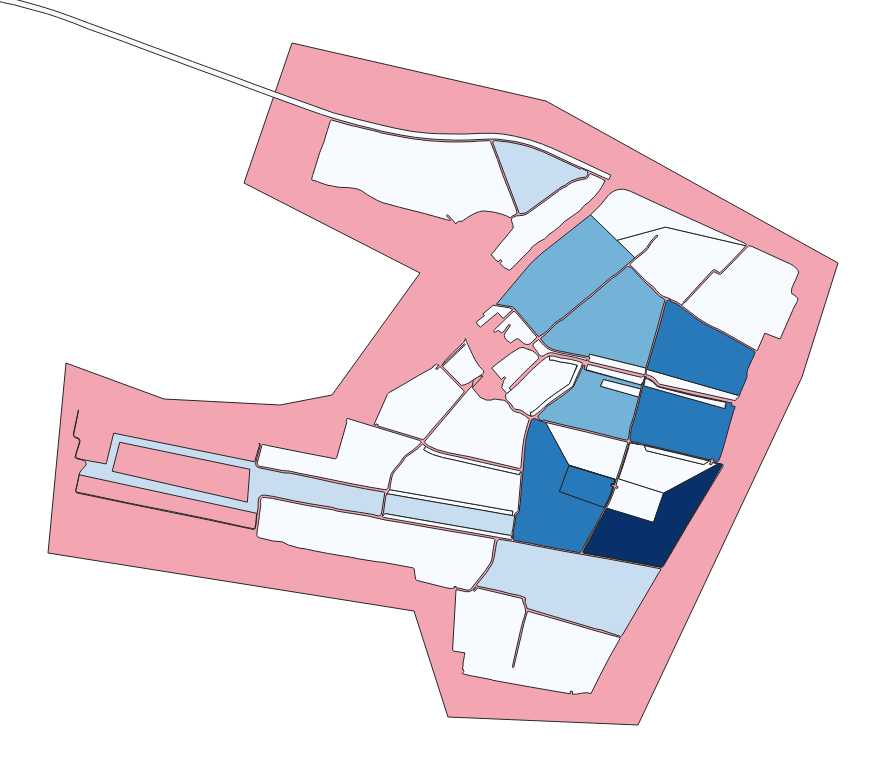
We are using this dataset just to experiment with the program. However, we will also need one specific polygon for the visualization later. So, draw one large polygon around all the fields in our subset, like this:
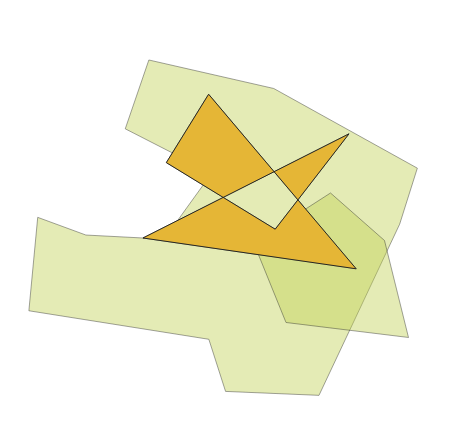
Also, draw a few polygons that overlap with each other (this is called a self-intersecting ring and is not a valid polygon, according to the OGC standard). Draw this to validate the data in the next step.
Once you’re done editing, turn off edit mode by clicking  again.
You have now drawn your first dataset! The same principle applies for drawing points and lines. Just make sure that when creating a new Geopackage layer, you choose Geometry type; line or point.
Topology Errors
Find the tool: Check validity.
Read the tool explanation on the right-hand side.
Run the tool on the PercelenZelfgetekend layer. You don’t need to change the settings.
We now have three additional temporary layers:
- Valid output
- Invalid output
- Error output
These new layers do not contain the original data. They only show where a possible error exists in the polygon topology.
Editing Polygon
Suppose you made a mistake, or you find an error in the existing data. Let’s improve that polygon ourselves.
In the Digitizing toolbar, enable editing on the layer you want to modify (PercelenZelfgetekend).
In the Digitizing toolbar, click on the Vertex tool.

With this, you can move and adjust the existing vertices of a feature. Several actions are possible:
Try the tool yourself.
- Remove vertices
- Move vertices
- Move edges (the line between the vertices)
Also, enable the Advanced Digitizing toolbar. Here, you have even more options for editing the polygon geometry. Try out these buttons on your dataset.
For example:
- Move a feature
- Rotate a feature
- Split a feature

Don’t forget to save the edits regularly. 
If you finish early, try creating a point dataset and drawing points.
Importing GPX files
Collect data from your phone
Get the collected .gpx files from your phone!
Cable > /osmand/tracks
/osmand/rec/tracks
Or
favorites: Share > send .gpx file to mail!
tracks: Share > send to your own mail!
Import GPX into Qgis
Do not use: Menu : Layer > Add layer > Add GPX Layer
But use: Menu : Layer > Add layer > Add vector Layer
Route_points
Routes
Track_points
Tracks
waypoints
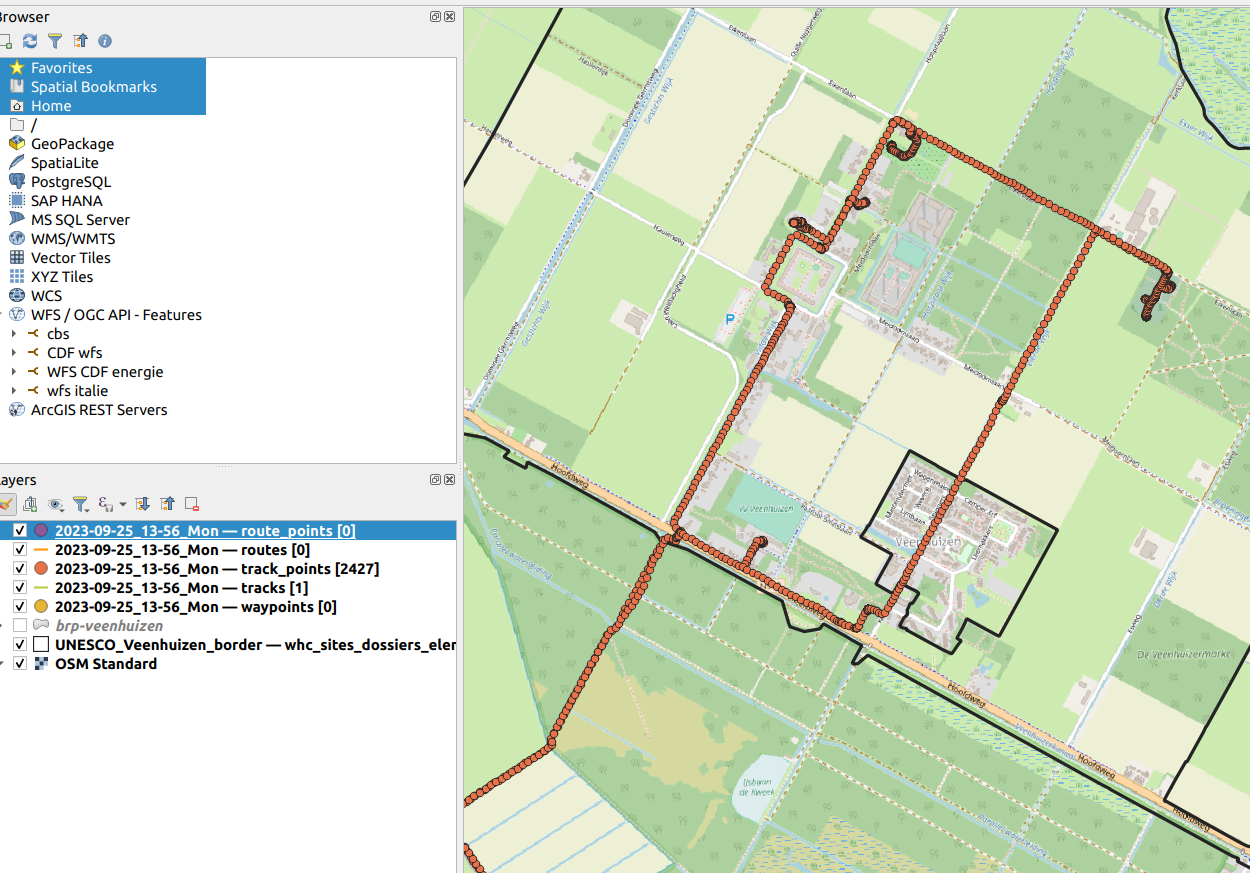
Transform points to segments!
Install the GPX segment importer. Go to the menu plugins > GPX segment tools > GPX segment importer
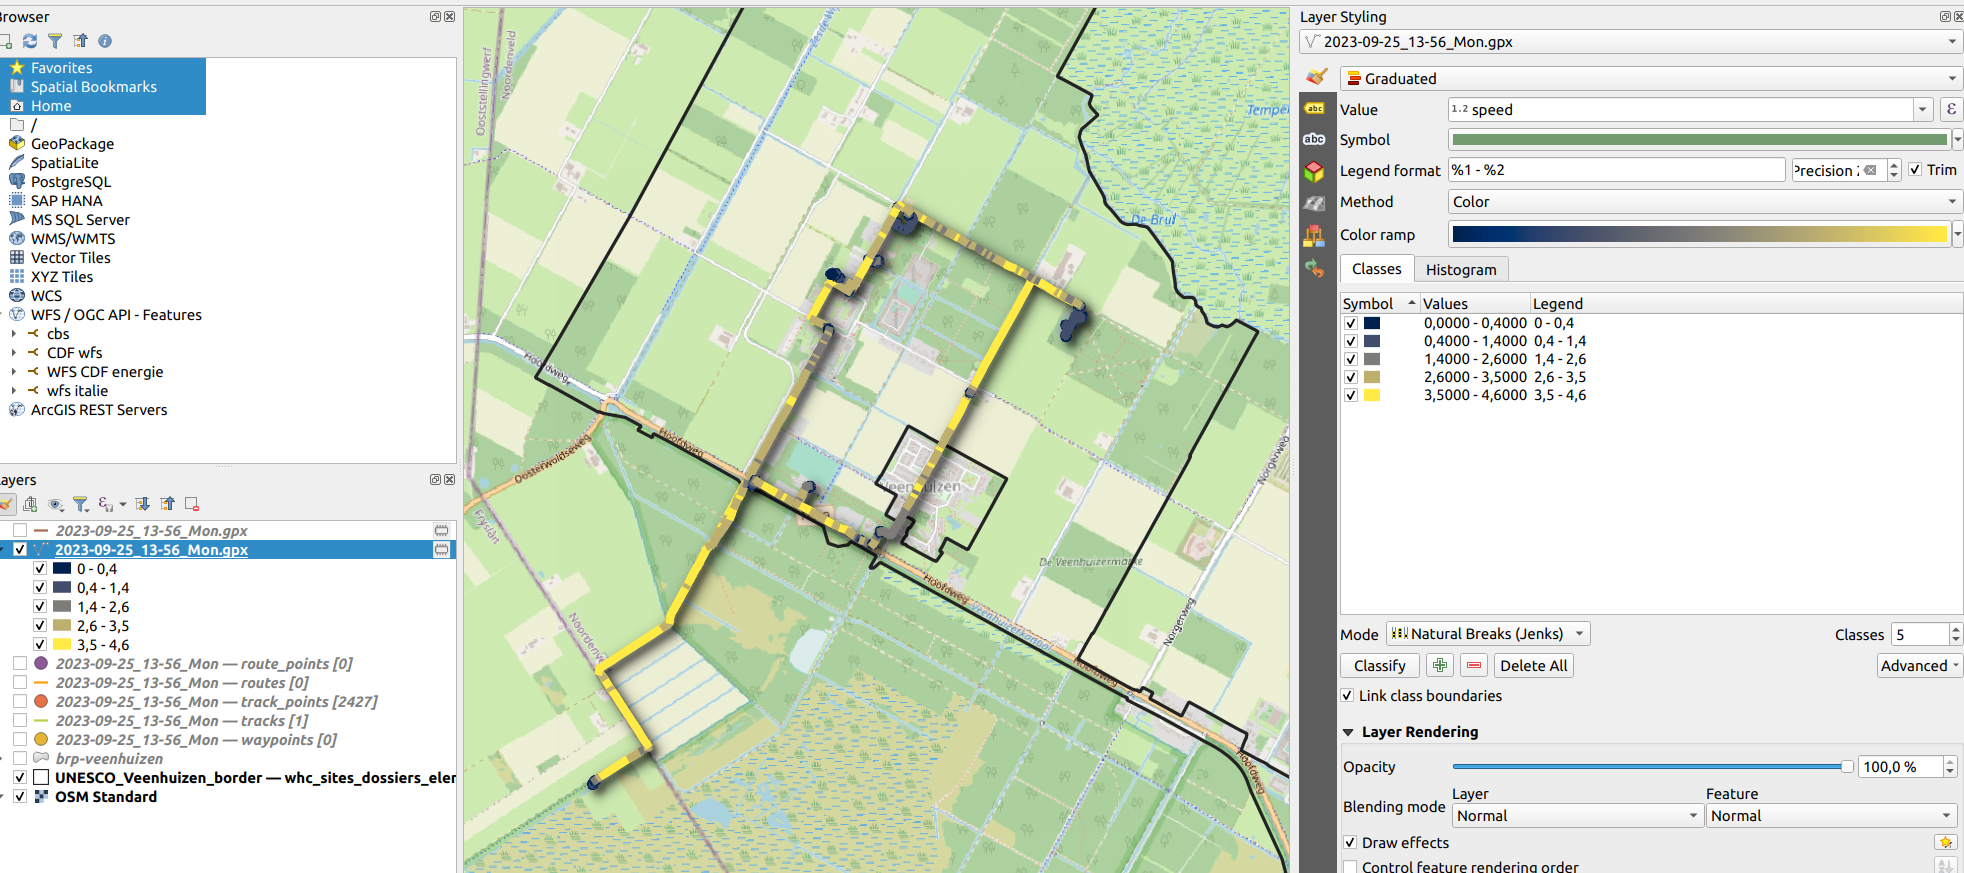
Editing attribute data of the GPS points
Adjust Column
We’re going to make the attribute table look a bit nicer.
Open the attribute table of segment layer you just created.
In the table, enter edit mode by clicking  .
.
Edit mode
Note! When you enable edit mode, it means you’re actually making changes to the existing dataset! Be very careful with this. Turn it on when needed, and turn it off as soon as you’re done!
Once in edit mode, you can manually adjust the values in the table. However, changing an attribute name, adding, or removing an attribute isn’t that straightforward. We’ll start by updating an attribute.
Open the Field Calculator.

Choose Update existing field and select the field _elevation_diff_.
In the expression field, enter:
round("_elevation_diff" ,2)
The round expression rounds up the number to 2 decimal places. .
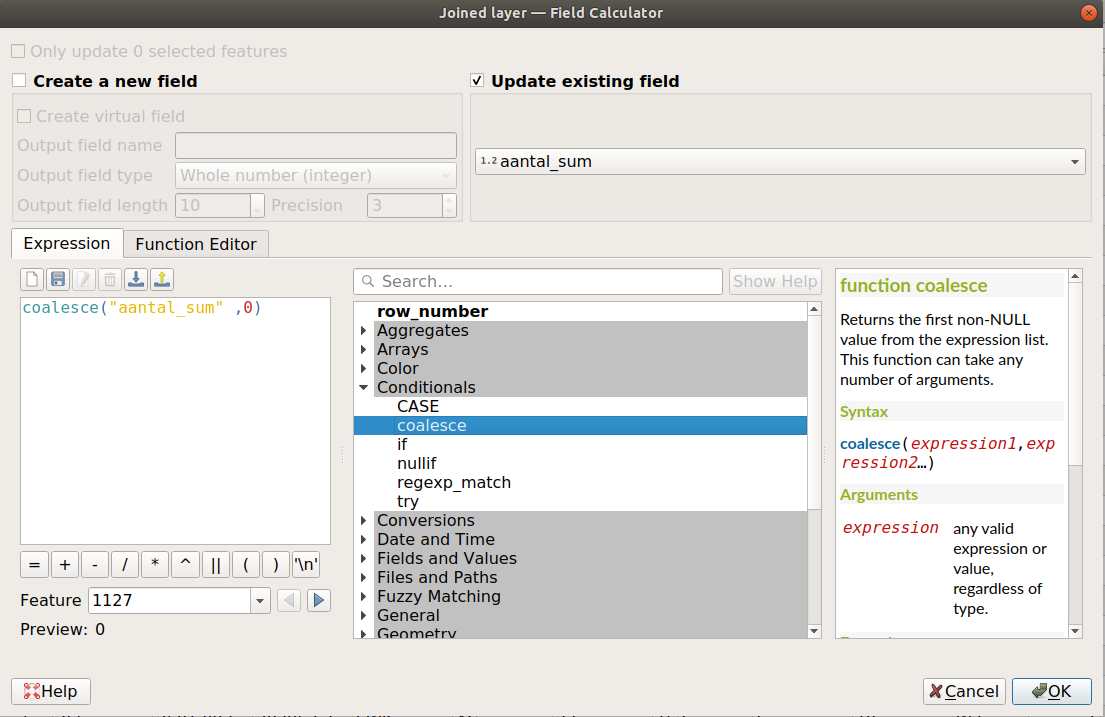
Press OK.
Do you see that the values in the column have been updated ?
Do the same for the distance column.
Save the edits!
Attribute Table - New Attribute
Open the Field Calculator again.

Create a new field named distance.
We are going to calculate the length of the segments!
Since this probably won’t be a neat round number, set the Output field type to Decimal number (real) with a precision of 2.
In the expression field we can use the geometries real sizes as input.
$length
Put $length in the Expression field and click on OK.

Turn off editing! By clicking the edit button again.

Attribute Table - Delete Column
Maybe we do not need all the columns. Let’s clean those up first.
Select the Delete fields button.

Delete the distance column.
Save the edits by saving them.

You reached the end of this workshop!


